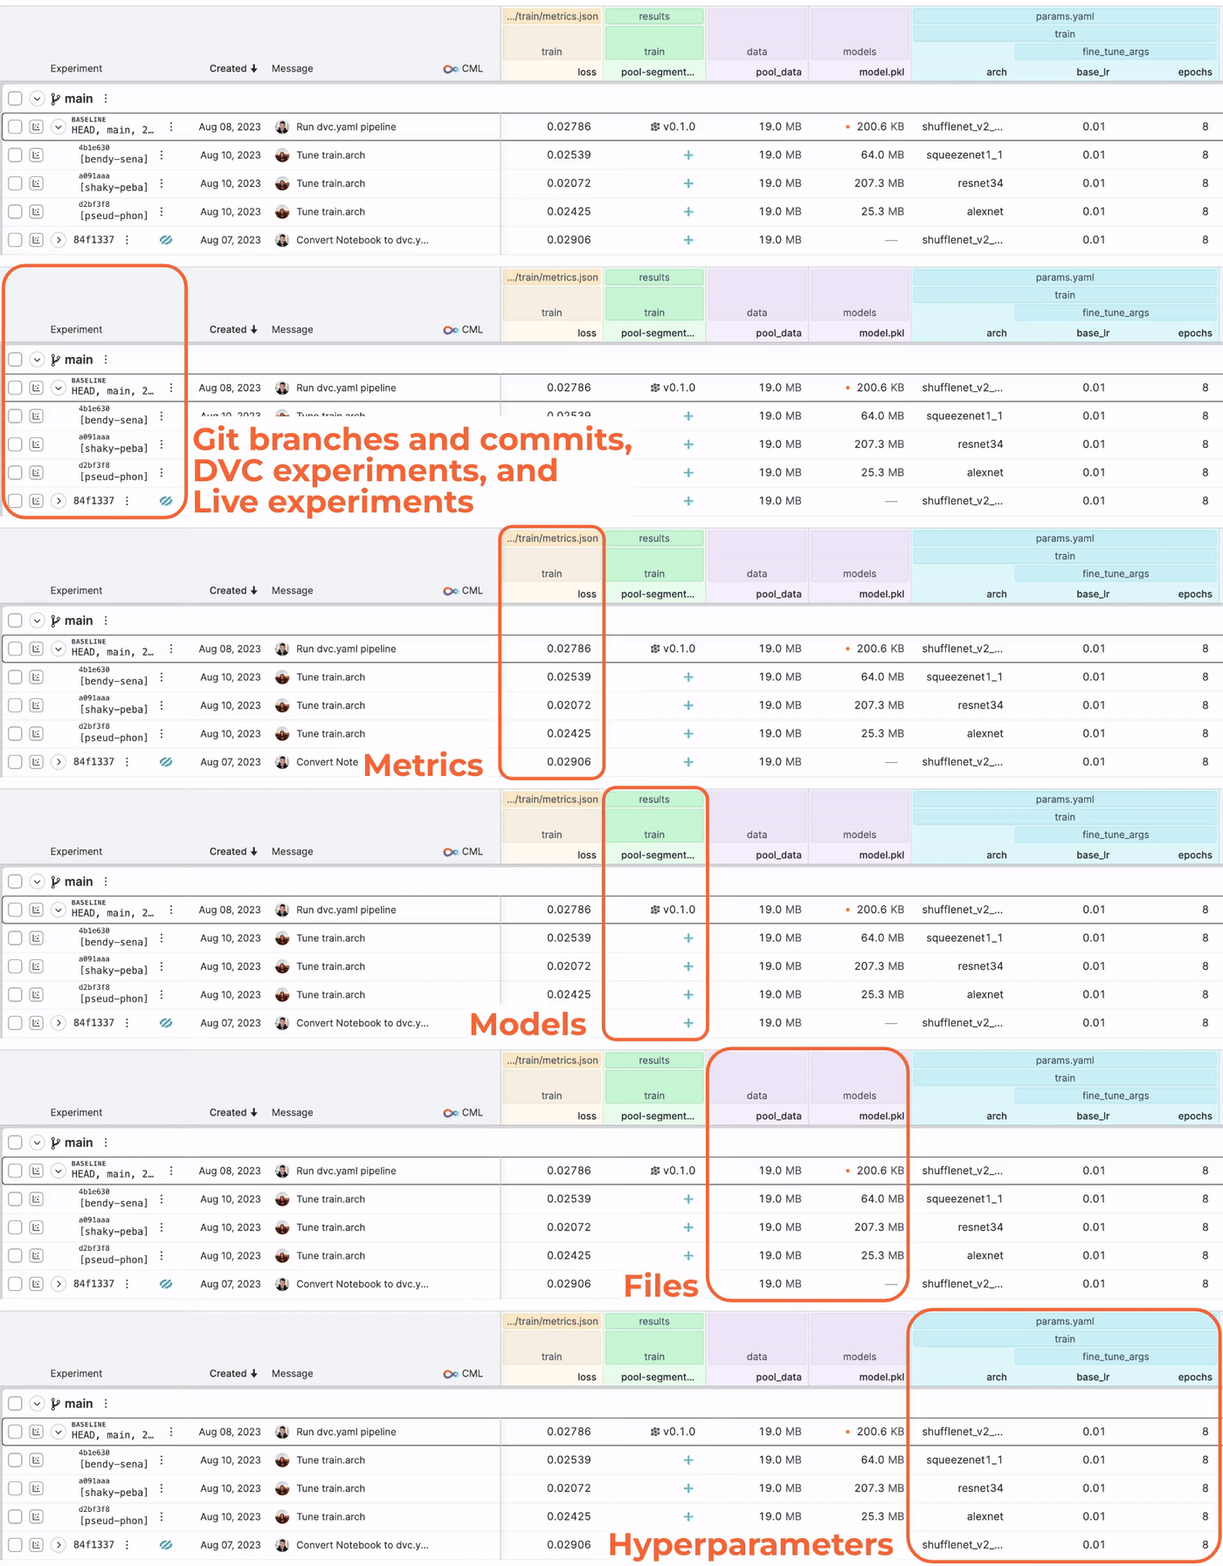
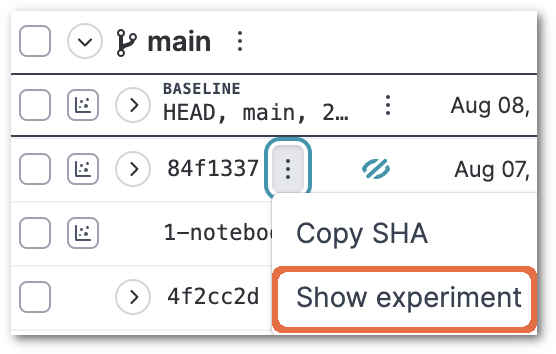
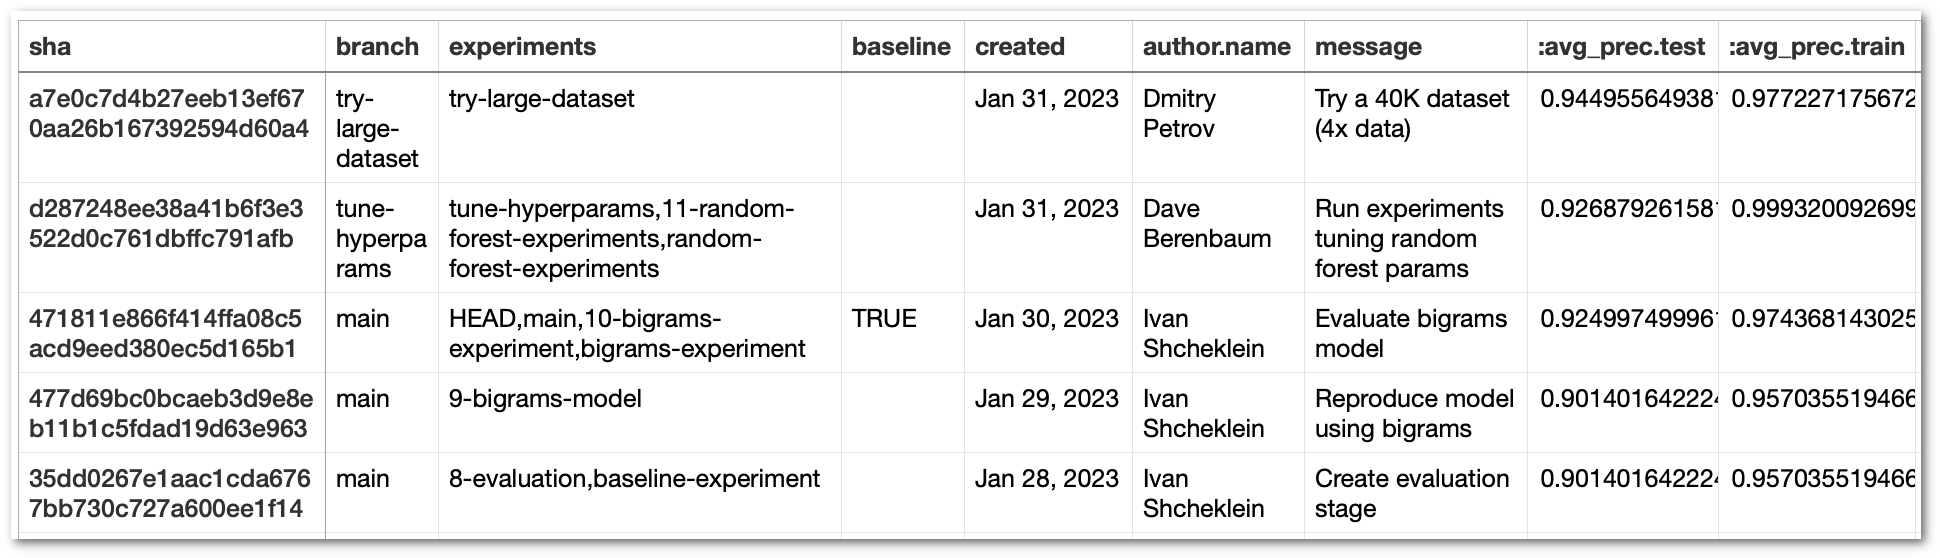
Branches and commits in your Git repository are displayed along with the
corresponding models, metrics, hyperparameters, and DVC-tracked files
(acquired by lakeFS).
Experiments that you push using the dvc exp push command as well as any live
experiments that you send using DVCLive are displayed in a special experiment
row nested under the parent Git commit. More details of how live experiments are
displayed can be found in the
live metrics and plots guide.
To manually check for updates in your repository, use the Reload button 🔄
located above the project table.
Tip
One simple way to briefly describe your experiments is to use meaningful commit
messages.
Nested branches
When a Git branch (e.g., feature-branch-1) is created from another branch
(e.g., main), two possibilities exist:
feature-branch-1 is still active (contains commits that are not present in
main). This can happen if the user has pushed new commits to this branch and
either hasn't merged it into main yet
or has merged it into main but has continued to push more new commits to
it after the merger.
Since the branch now contains new unique commits, the project table will
display both main and feature-branch-1 separately. feature-branch-1 will
show the new commits that are not part of main while all the merged commits
will be shown inside main.
feature-branch-1 is inactive (does not contain any commits that are not
present in main). This can happen in two cases:
if the user has not pushed any new commits to feature-branch-1
if the user has merged feature-branch-1 into main and has not pushed any
new commits to it after the merger.
Since the branch does not contain any new unique commits, DataChain Studio considers
feature-branch-1 as "nested" within main and does not display it as a
separate branch. This helps to keep the project table concise and reduce
clutter that can accumulate over time when inactive branches are not cleaned
from the Git repository. After all, those inactive branches usually carry no
new information for the purpose of managing experiments. If you would like to
display all commits of such an inactive branch, use the
Commits on branch = feature-branch-1 display filter.
Display preferences
The table contains buttons to specify filters and other preferences regarding
which commits and columns to display.
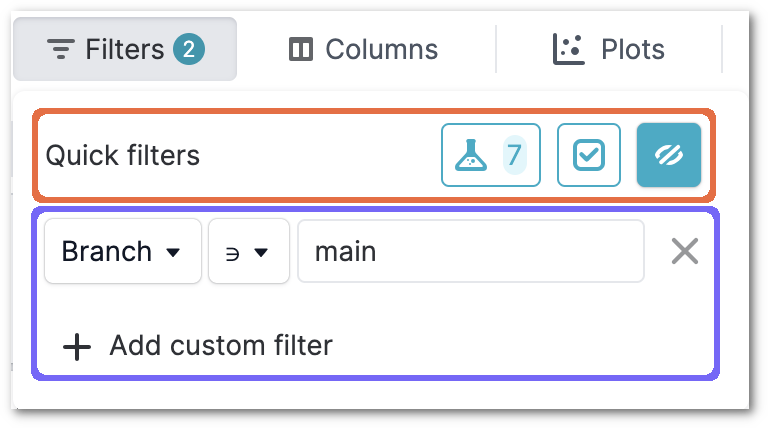
Filters:
Click on the Filters button to specify which rows you want to show in the
project table.
There are two types of filters:
Quick filters (highlighted in orange above): Use the quick filter buttons
to
Show only DVC experiments
Show only selected experiments
Toggle hidden commits (include or exclude hidden commits in the project
table)
Custom filters (highlighted in purple above): Filter commits by one or
more of the following fields:
Column values (values of metrics, hyperparameters, etc.) and their deltas
Git related fields such as Git branch, commit message, tag and author
Info
The Branch filter displays only the specified branch and its commits.
When a Git branch is nested inside another branch, the project table
does not display the nested branch. If
feature-branch-1 is nested within main, feature-branch-1 is NOT
displayed in the project table even if you apply the
Branch = feature-brach-1 filter.
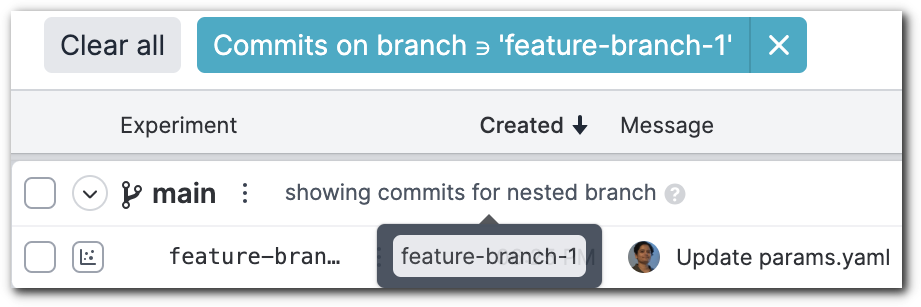
In this case, if you would like to filter for commits in feature-branch-1,
you should use the Commits on branch = feature-branch-1 filter. This will
display the main branch with commits that were merged from
feature-branch-1 into main. A hint is present to indicate that even
though the commits appear inside main, they are part of the nested branch
feature-branch-1.
The Custom filters can be un-applied without deletion, allowing you to
create the filters once and toggle them on and off as needed.
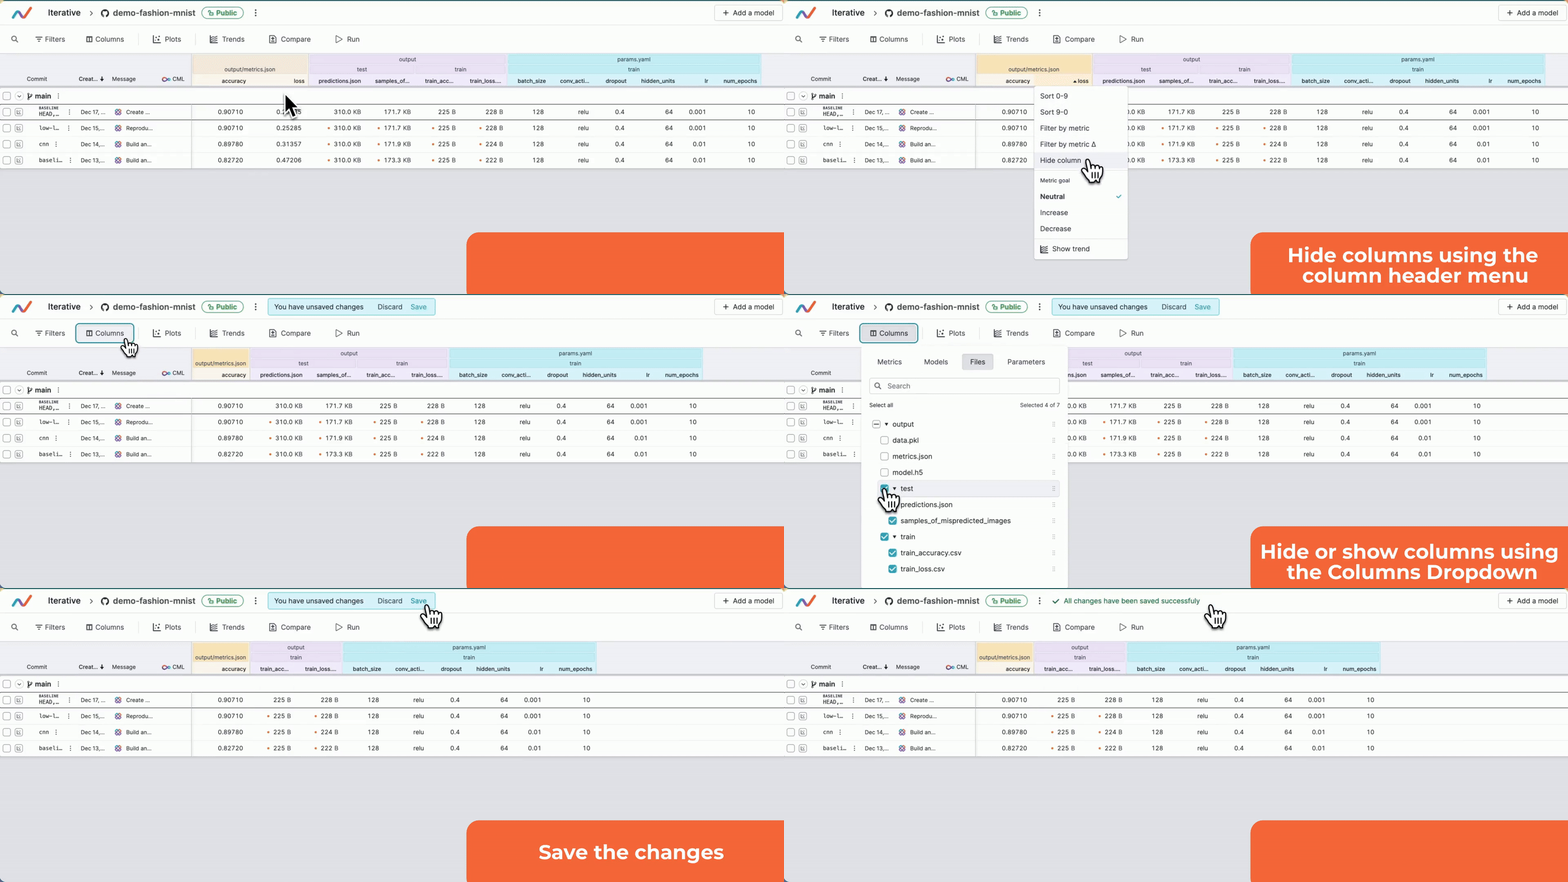
Columns:
Select the columns you want to display and hide the rest.
If your project is missing some required columns or includes columns that you do
not want, refer to the troubleshooting guide for more
information on managing project columns and settings.
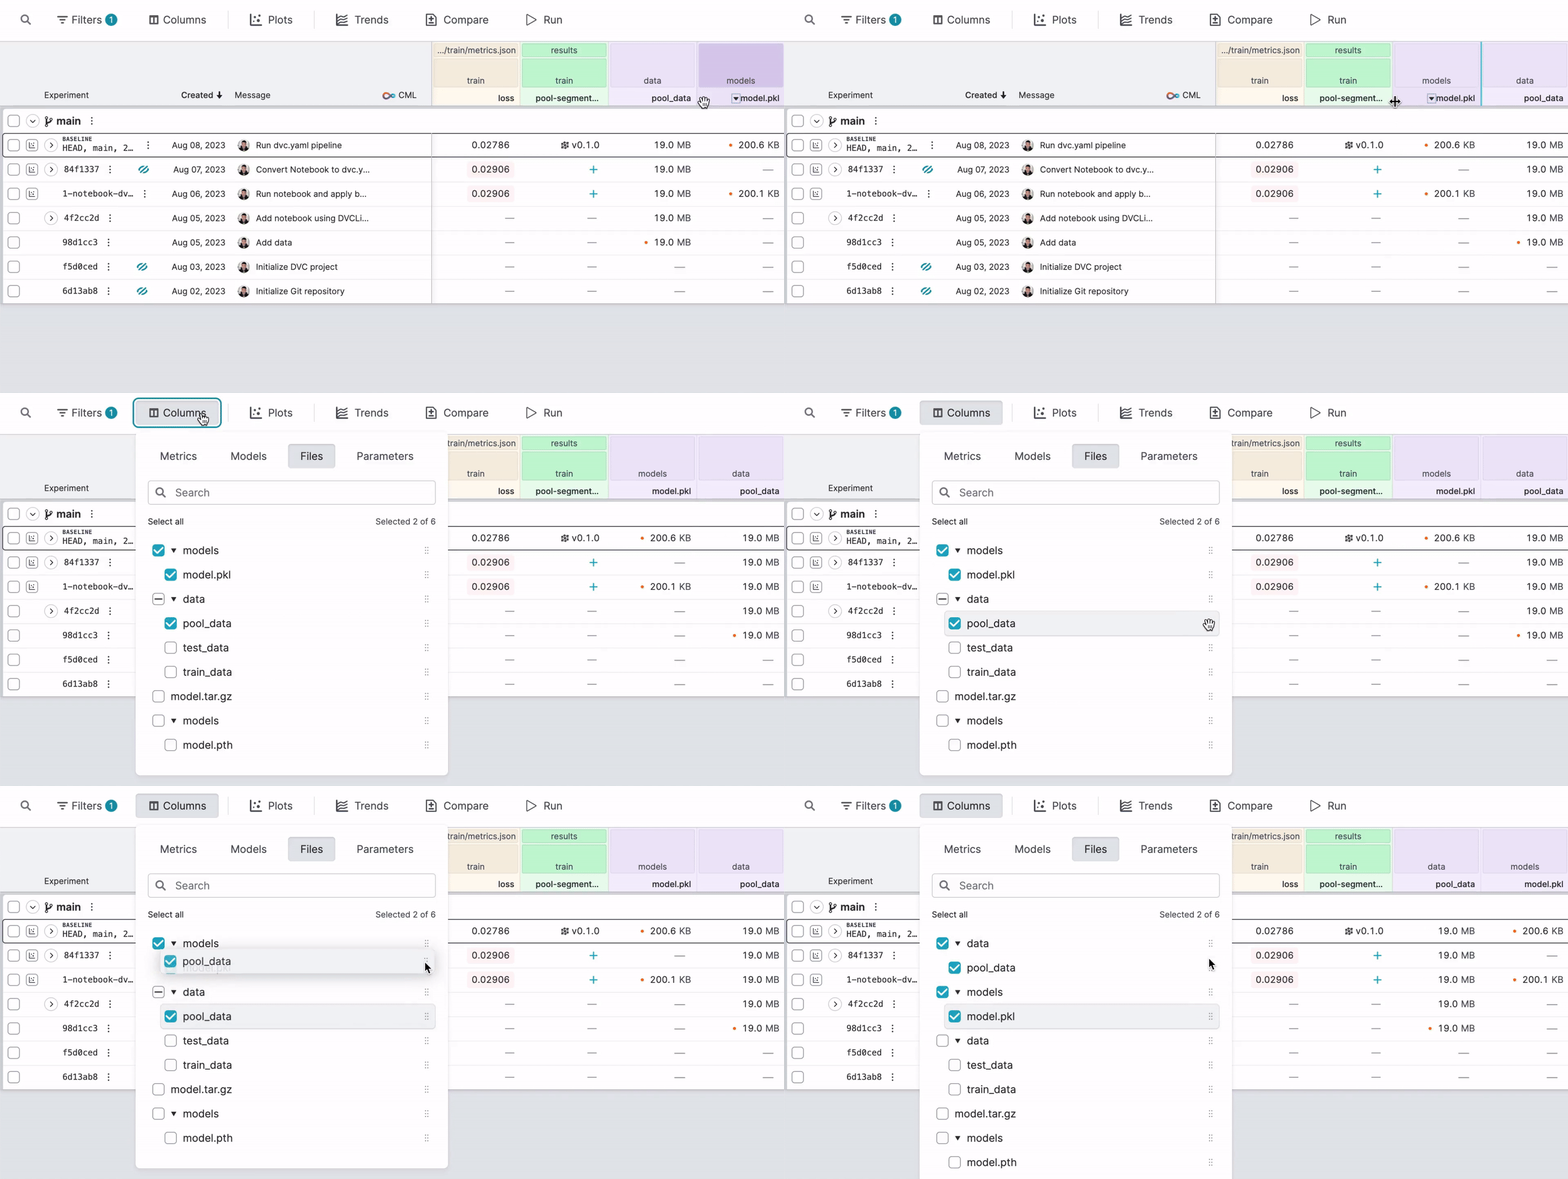
To reorder the columns, click and drag them in the table or from the Columns
dropdown.
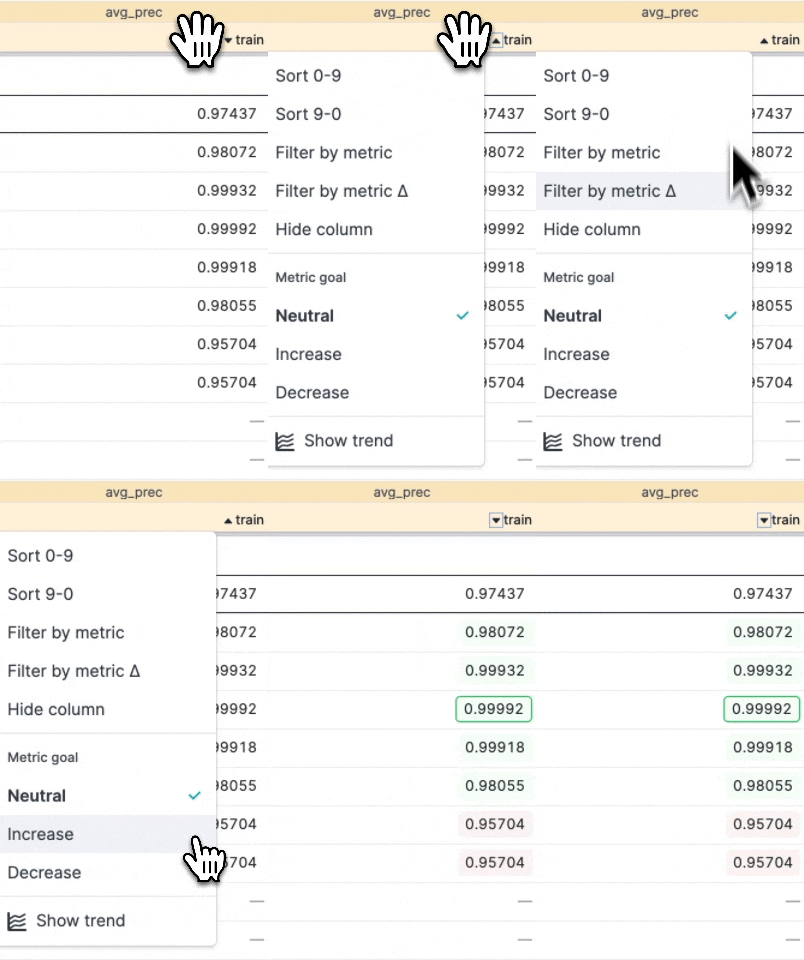
Columns menu and goals: Click on the column header to open a context menu
with actions such as sorting and filtering the project table by the column's
values.
For metrics, you can also specify goals, which indicate whether an increase or a
decrease in the metric's value is desirable. Once a goal is set, the metric's
values for all rows are compared against the value in the baseline row. Values
that are better (higher or lower, depending on the goal) than that in the
baseline row are highlighted in green, with the best one shown with a green
border. Values that are worse than that in the baseline row are marked in pink.
Info
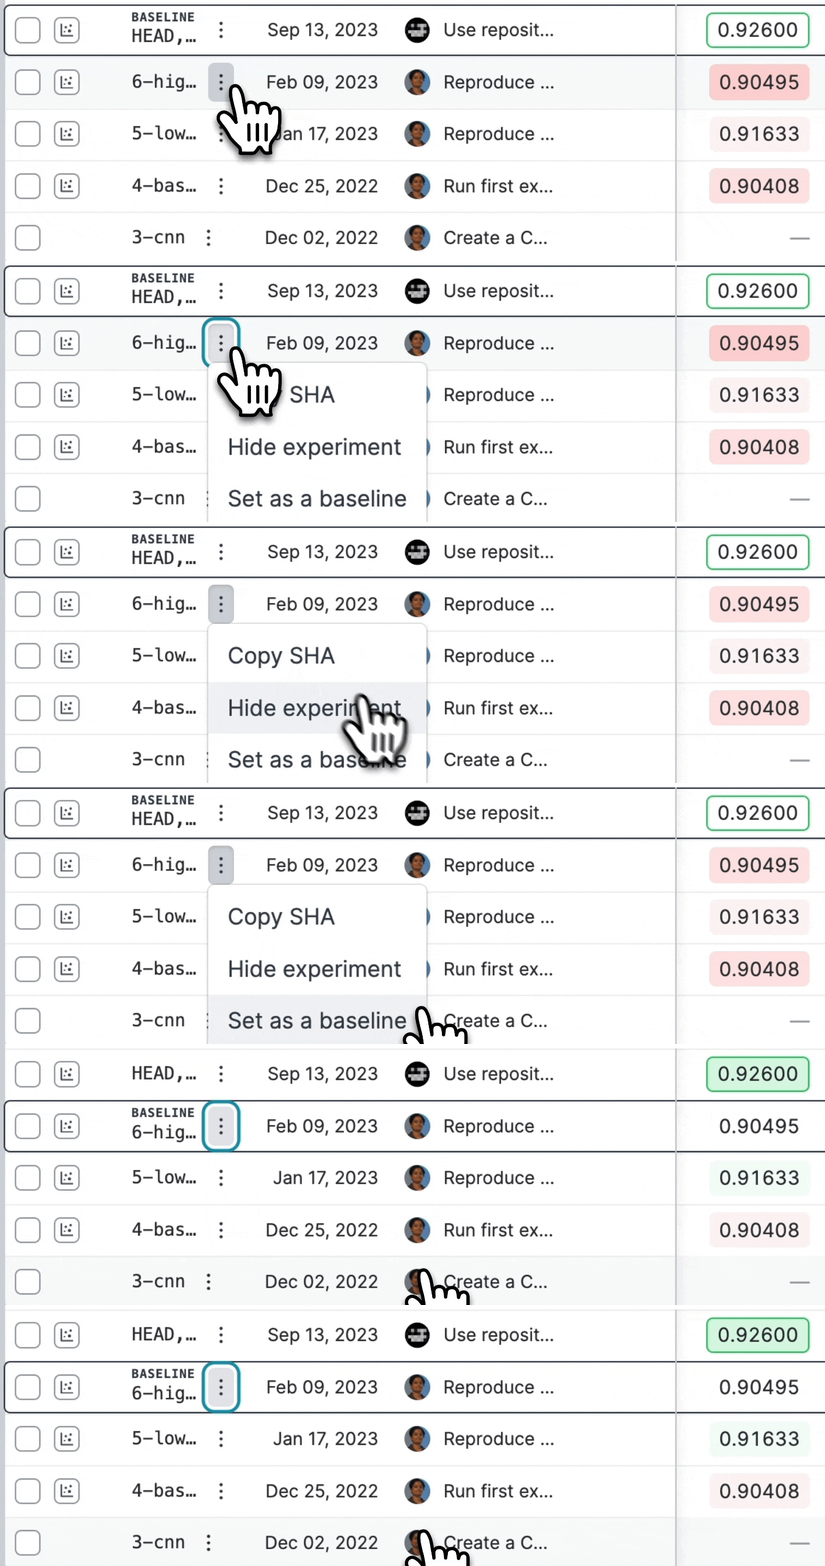
To change the baseline row in your project, use the 3-dot menu of the row which
you want to set as the new baseline.
Hide commits:
Commits can be hidden from the project table in the following ways:
DataChain Studio auto-hides irrelevant commits: DataChain Studio identifies commits
where metrics, files and hyperparameters did not change and hides them
automatically.
DataChain Studio auto-hides commits that contain [skip studio] in the commit
message: This is particularly useful if your workflow creates multiple
commits per experiment and you would like to hide all those commits except the
final one.
For example, suppose you create a Git commit with hyper-parameter changes for
running a new experiment, and your training CI job creates a new Git commit
with the experiment results (metrics and plots). You may want to hide the
first commit and only display the second commit, which has the new values for
the hyper-parameters as well as experiment results. For this, you can use the
string [skip studio] in the commit message of the first commit.
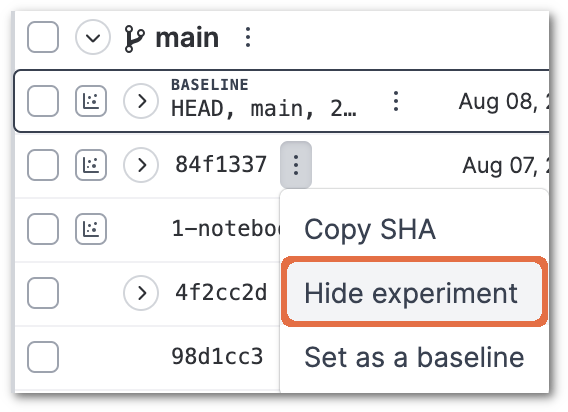
Hide commits and branches manually: This can be useful if there are
commits that do not add much value in your project. To hide a commit or
branch, click on the 3-dot menu next to the commit or branch name and click on
Hide commit or Hide branch.
Unhide commits: You can unhide commits as needed, so that you don't lose
any experimentation history. To display all hidden commits, click on the
Show hidden commits toggle (refer filters). This will display
all hidden commits, with a hidden (closed eye) indicator.
To unhide any commit, click on the 3-dot menu for that commit and click on
Show commit.
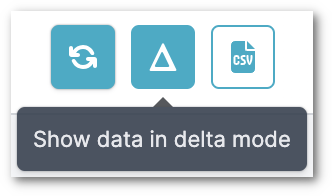
Delta mode
For metrics, models and files columns with numeric values, you can display
either the absolute values or their delta (difference) from the baseline row. To
toggle between these two options, use the Delta mode button.
Save changes:
Whenever you make any changes to your project's columns, commits or filters, a
notification to save or discard your changes is displayed at the top of the
project table. Saved changes remain intact even after you log out of DataChain Studio
and log back in later.
Visualize and compare experiments
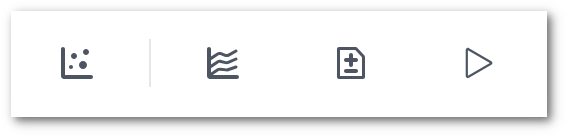
Use the following buttons to visualize and compare experiments:
Plots: Open the Plots pane and
display plots for the
selected commits.